
Journey maps visualize the process that a customer goes through to accomplish a goal. They are created by compiling a series of user tasks and actions into a timeline, alongside user thoughts and emotions, in order to create a narrative. This narrative communicates insights that inform the design process.
There are many digital tools that help distributed teams compile journey maps into digital formats. This article provides a simple spreadsheet template for virtual customer-journey mapping. You can also use this template as a first step for digitizing the output from an in-person journey-mapping workshop.
How to Use this Template
- Access the template. Visit the Google Spreadsheet template link here and make a copy to your own drive (File > Make a copy). Note, you must be logged into your Google account in order make a copy. Alternatively, there are also downloadable Excel and Numbers versions at the bottom of this article.
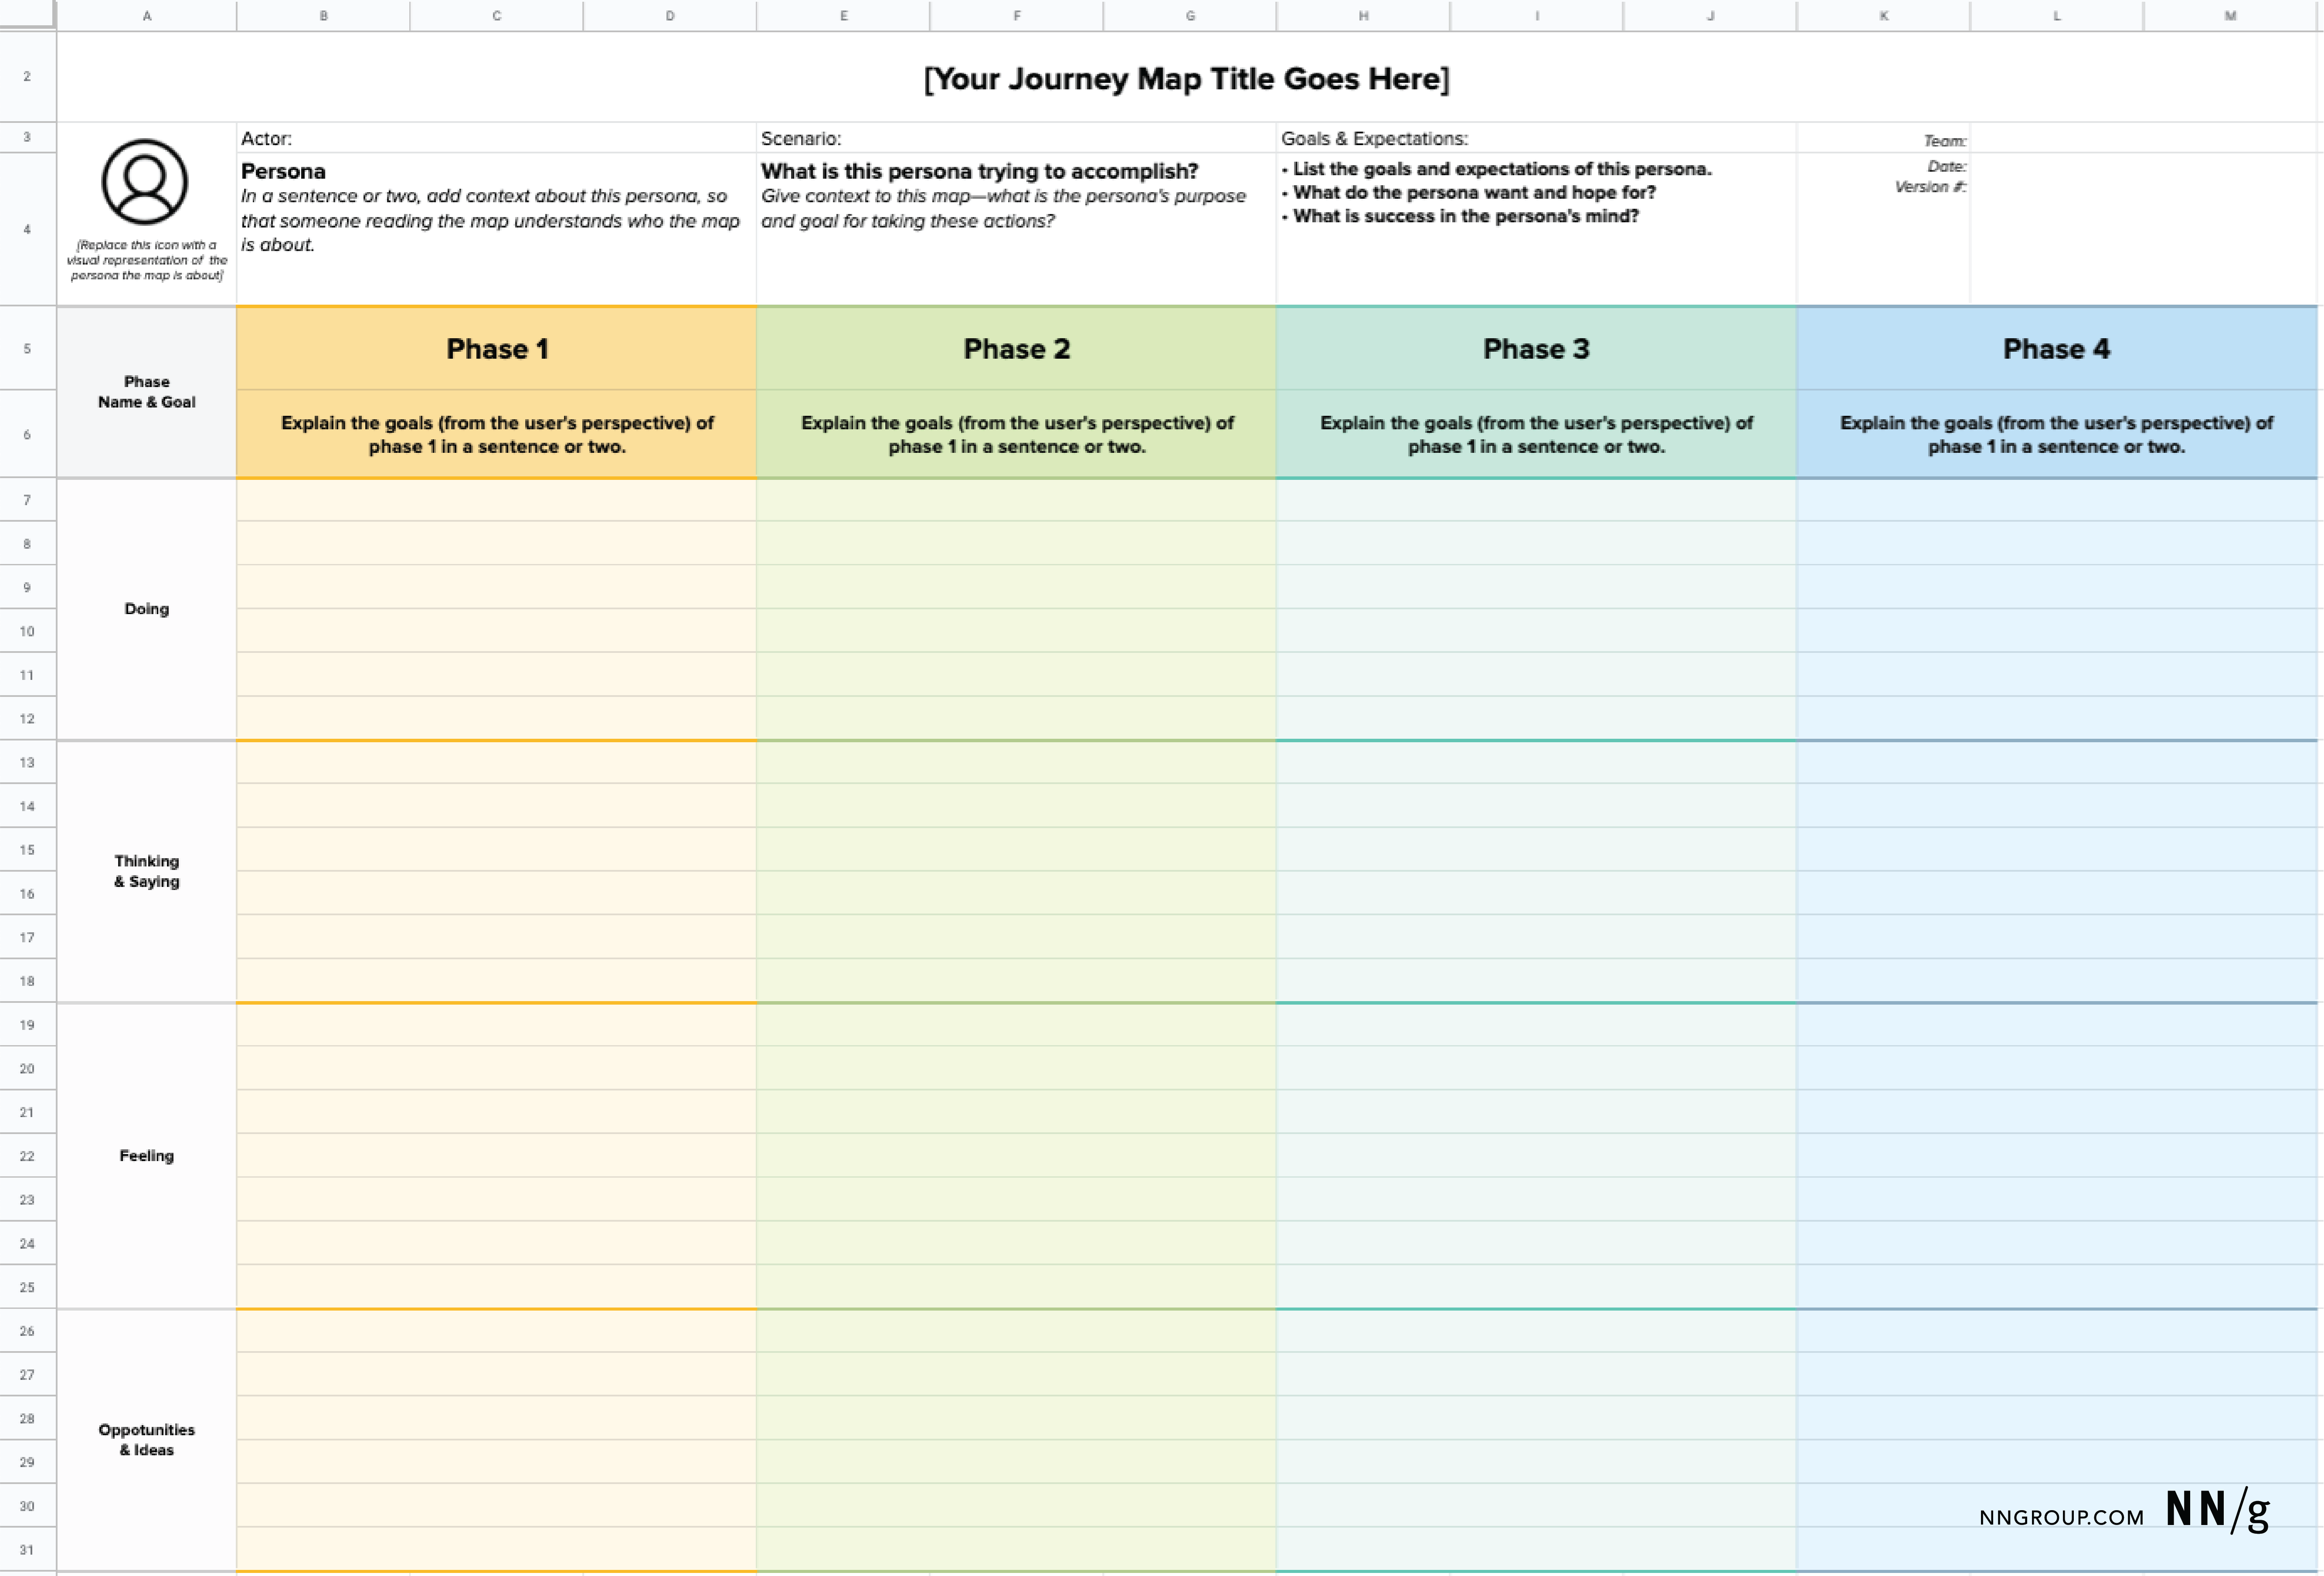
- Identify the point of view. In your own copy of the template, identify the lens (rows 2–4) of your customer-journey map. Includes the map title, persona, scenario (the specific experience being mapped), and corresponding goals and expectations of the user. Be sure to also include the internal team who is making the map, the date, and the version number (to communicate that the map is a living artifact).
- Create the narrative. Next, describe the phases of the customer journey (rows 5–6). Then, for each of the phases, identify the user’s actions (rows 7–12), thoughts and expressions (rows 13-18), and emotional experience (rows 19–25). Note, these data points should be based on qualitative research such as field studies, contextual inquiry, and diary studies.
- Capture insights and opportunities. These are critical, yet often overlooked elements. Any insights that emerge should be explicitly listed (rows 26–31). If politically possible, you can also assign ownership for different parts of the journey map, so that it’s clear who’s in charge of what capitalizing on each opportunity.
- Analyze the map. Collaboratively analyze and identify the highs and lows of the customer journey. In areas where the user’s expectations are not being met, more time is spent, or there are unnecessary touchpoints, fill the corresponding Negative cell (rows 38–40). When the user experience hits a high point, fill in the corresponding Positive cell (rows 34–36). This approach creates a scannable journey profile that quickly conveys where the user’s experiences highs and lows across the journey.

When and Why to Use this Template
While there are several levels of digital tools available for remote customer journey mapping, a spreadsheet is an efficient, effective choice for many teams, for several reasons:
Compatible format and structure. The columns and rows of a spreadsheet can be easily adjusted to accommodate the structure of a journey map. Rows align to a journey map’s four primary swim lanes: phases, actions, thoughts, mindsets/emotions; columns align to the phases of the journey. The simplicity of this grid structure allows teams to focus on the content, rather than on the layout or visual characteristics of the artifact. This mid-fidelity format can be used as a first step to digitizing in-person mapping work, or conversely, as a precursor to making a high-fidelity journey map, when you are still gathering and organizing various inputs.
Inclusive of various expertise. Unlike other drag-and-drop tools or design-oriented tools, spreadsheets are widely used across many different domains. Using a tool familiar to others has two major benefits. First, there is no technical-onboarding time needed (no need to create an account and learn how the tool works before contributing). Second, it increases the likelihood that others will develop a sense of ownership and responsibility towards the artifact and they will truly contribute to it. If an edit in the future is needed, anyone can return to the original artifact and easily update it. In contrast, if the artifact is hosted in dedicated, highly specialized software, people may not know how to edit it (even if they did that initial onboarding, chances are they’ll forget how to use the software if they don’t use it regularly) and the responsibility to keep the artifact up to date will fall solely on one or few people who are familiar with the program (e.g., a designer).
Accessible to most companies. Many organizations have strict policies about the software their employees use due to data-protection issues. However, most of these companies have their own internal set of tools, almost all of which include some breed of a collaborative spreadsheet.
Helpful Reminders
- You should adapt the template as needed. Don’t be afraid to add another phase, expand a swim lane, or take any other liberties with the template provided. It is only intended to be a starting place.
- Treat your journey map as a living artifact. Customer-journey maps need to be updated to stay relevant and reliable. Including version numbers and the date of last update on the artifact itself helps others understand that this artifact is subject to change and evolve.
- Don’t forget, collaborate with others. The process used to build the map is just as important as the map itself. Successful journey maps are not just about the resulting artifact and should be more treated as more than a checklist of the “right” elements. They should be informed by well-defined goals, and built from research.
We originally developed this template for use in group exercises in the course on Journey Mapping to Understand Customer Needs when we took the UX Conference virtual. Download our template from the link below and feel free to use it on your own projects. Happy mapping.