


Figma, faster 🏎


Imagine the frustration of trying to pound in a nail when the hammer trails behind your hand by half a second.
For design tools to be effective, speed is essential. If there are delays in the wrong places, it totally ruins the illusion that the tool is an extension of your mind and body. Imagine the frustration of trying to pound in a nail when the hammer trails behind your hand by half a second.
We want Figma to be an extension of your creative mind. To meet that goal, we need to remove as much friction as possible from the process of placing your ideas into a visual space to discuss, collaborate on and convert into working software. To reduce that friction, we need an ongoing focus on Figma’s performance.
Since the beginning, we’ve tried to design every feature with performance in mind. When we discover targeted performance wins through careful analysis of our code (running on real documents that users share with us), we take them. Occasionally, however, opportunities to reap huge wins present themselves.
We want Figma to be an extension of your creative mind.
Earlier this year, we figured out that restructuring our document renderer and ironing out WebAssembly bugs could make Figma significantly faster. We worked on these optimizations for months. The reward was massive improvements in zooming, dragging and file loading speed (up to 3x faster!) in dense files.
We rolled out these changes to the entire user base over the past several weeks. Read on to learn more about what changed, how we measured these gains, and what’s next for performance work in Figma.
File loading — up to 3x faster
As our product matures, we’ve noticed teams at large organizations creating ever more complex design documents in Figma. Users push our tool to its limits, nesting components many layers deep to give them flexibility and power in their design systems.
The Fluent Design Team at Microsoft, for example, rebuilt every Windows native control in a single Figma document, capturing components in all possible states and permutations. These seemingly simple operations add a lot of computational complexity, and load times suffered.
“We were stress-testing the limits of what Figma could do before we adopted it as our team’s primary tool,” Kyle Anderson, Senior Product Designer on the Fluent team, told us.
Fortunately, over the last 2 months WebAssembly optimizations and a collection of other changes helped us reduce the load time for a large realistic document from 29 seconds down to under 8 seconds.
"It’s considerably more lightweight and much more performant,” Kyle said. “The speed at which your team hot fixes stuff is really encouraging, and we couldn’t be happier with the product." WebAssembly is now enabled in all the common places that our users work within Figma [1]. This includes the desktop app, Chrome, Firefox, and Safari on both macOS and Windows. The impact of this is huge across the board.
Continuous Interactions
Of course, the importance of performance doesn’t end when your file has loaded. Two of the most common operations where Figma users need speed are zooming in/out and dragging layers.
We renewed our focus on improving the fluidity of these common behaviors, and since the beginning of the year, we’ve reduced the “hitches” you see when zooming or dragging.
Zooming is now up to 3x faster.
Dragging is now up to 3x faster.
N3TWORK, a 100-person gaming and media company, particularly appreciated these improvements. Their files are dense and packed with bitmap images, so their UX Design Director Adam Donkin came by in person to talk through performance. “That’s one of the best things about Figma — I feel like I’ve built a relationship with people there, and we work through problems together,” he said. “It makes it feel like Figma is my product.”
After a few minutes diagnosing the issue with Adam in person, we enabled our new renderer for N3TWORK. They saw an instantaneous uptick in the speed of component publishing and file loading. “You didn’t have to measure it, it was completely obvious,” Adam said. “I walked back to the office and several people had tested it and were seeing improvements in all cases. That was super exciting.”
Why we measure both average frame time & maximum frame time
With continuous operations like zooming and dragging, it’s smoothness we care about, not duration. There’s a huge experiential gap between a drag taking 500ms and getting no feedback until it’s complete versus a drag taking 500ms where you’re getting full visual feedback at 60 frames per second.
One of our design team’s guiding principles is “favor direct manipulation,” and nothing breaks the illusion of direct manipulation like delayed and infrequent feedback.
One of our design team’s guiding principles is “favor direct manipulation.”
To measure the quality of this feedback, we track two key metrics: average frame time and maximum frame time. Each contribute to smoothness in dragging, so they both must be monitored to understand the impact of an optimization.
Higher maximum frame times produce a jarring “hitching” effect, like your sailing boat suddenly hitting a rock. In comparison, higher average times produce choppiness, like driving a car over cobblestones.
The below examples show this difference between the two in practice.
With this example of maximum frame times degrading, all three gifs have an average frame rate of 15fps. In the leftmost animation, every frame is 67ms. In the center animation, most frames are 33ms, but every sixth frame is 200ms long. In the right animation, most frames are 33ms, but every eleventh frame is 367ms long.
Despite one metric staying constant, the other degrades enough to make the path of the ball seem jarring.
In the next example, it’s the average frame time that degrades from left to right. Rather than switching between smoothness and hitching, a low average frame rate produces a choppy appearance.
All three of these have a maximum frame time of 167ms, with most frames taking 33ms. In the left animation, however, the 167ms hitches happen every 28th frame. In the center animation, every 10th frame. In the right animation, every 4th frame.
In an ideal world, applications would never drop below 60fps. As we move towards that world, however, it’s helpful to monitor both of these metrics over time. We could instead look at a full histogram of frame times, but it would be difficult to chart our progress over time with so many variables.
Tracking Figma’s average and maximum frame times
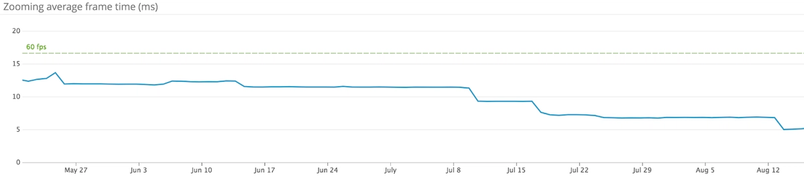
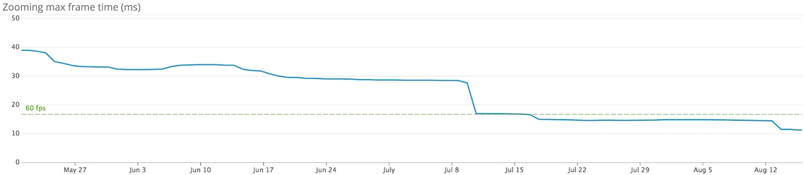
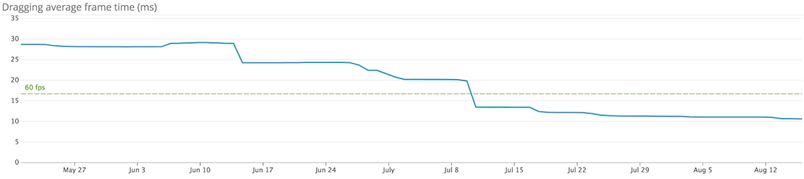
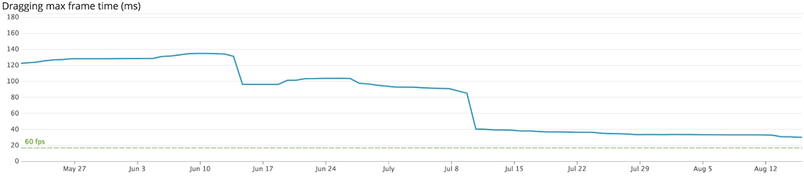
We measured our progress over the last 3 months for zooming and dragging in a complex document in terms of average and maximum frame times.
As you can see from the charts below, both zooming and dragging frame times decreased. For zooming in our benchmark document, we’ve maintained the necessary average frame time for 60fps and reduced the max frame time enough to avoid dropping any frames. For dragging, we improved the average frame from 30fps to 60fps, and reduced hitches from 120ms to 30ms, dropping a single frame instead of six during the hitch.


Behind the scenes: details for the skeptics
To optimize Figma, we need benchmark tests that are consistent, but also realistic. To count as consistent, they must do exactly the same thing every time, so we can tell when performance improvements are the result of a code change versus a changing usage pattern. For them to be realistic, we need to be testing against real design files, not just files containing grids of 1000 gray rectangles. Making Figma really fast for unrealistic use cases isn’t terribly helpful to anyone 🙂.
To create consistent and realistic benchmarks, we run a version of our app in Electron (basically a fancy wrapper around Chrome), and simulate user interactions like dragging, panning, zooming, selecting, and a few other key interactions. We measure how long we’re spending in key parts of the code (event processing, rendering, UI updating, etc.), and track those over time.
Once the benchmarks complete, the results are reported to Datadog where we set up alerts. These benchmarks run on every commit, so when performance regresses, we get email notifications and can tie the regression to specific code changes. Once we determine the source of the regression, we either fix the regression or undo the change until we can figure out a way of delivering the same functionality without the performance hit.
What’s coming next: copy, paste, delete, undo, Mirror improvements and more
Of course, we’re not done here. We’re committed to making the experience of using Figma as fast as possible, and we want to focus on the areas affecting people most deeply.
While we’ve made strides on loading time, there’s still a lot of work to be done. We have a few major architectural changes underway that should yield huge benefits for loading time. The benefits will be especially pronounced for loading prototypes and working in the Figma Mirror app.
We’ve also recently rolled out changes to help us monitor operations that result in Figma locking up for more than 100ms, and have identified a few significant areas to start with: copy, paste, delete, undo, redo, and export.
Stay tuned!
Footnotes
(1): We announced this win last year, but truly realizing it has been a journey involving discussion with the Chrome WebAssembly team, diving into their compiler source, finding workarounds to dodge compiler deadlocks, and contributing patches to Electron to backport Chrome GPU bug fixes.